GIS Datasets – Waterfowl
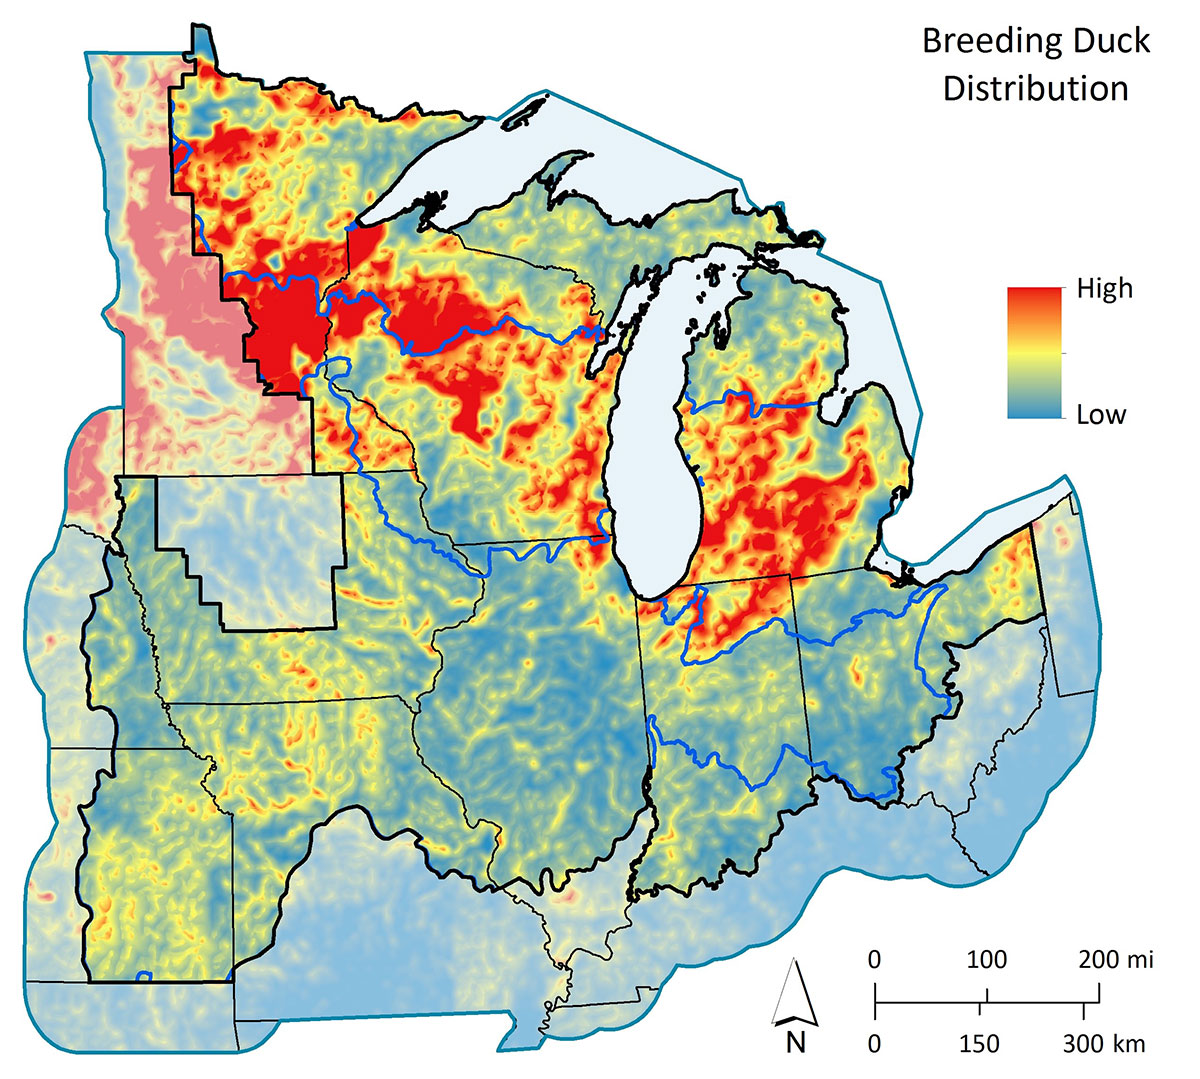
Breeding Duck Distribution
Estimated density and distribution of breeding habitats for primary duck species combined (Mallard, Wood Duck, Blue-winged Teal, and Ring-necked Duck = planning focal species and 85% of total breeding ducks).
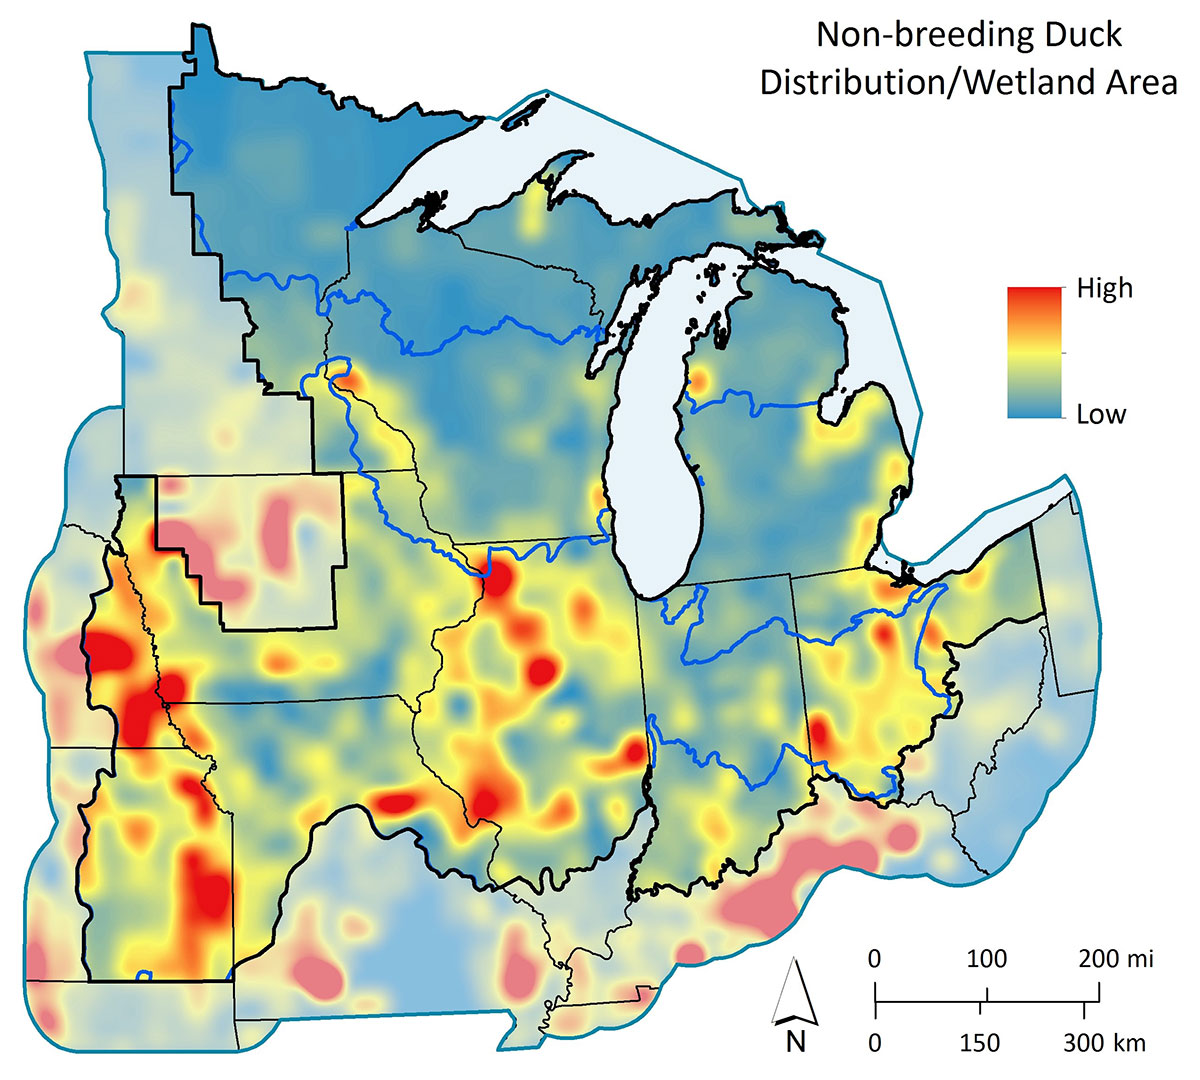
Non-breeding Duck Distribution/Wetland Area
Distribution of important non-breeding habitats, based on county-level duck harvest relative to county size and wetland coverage.
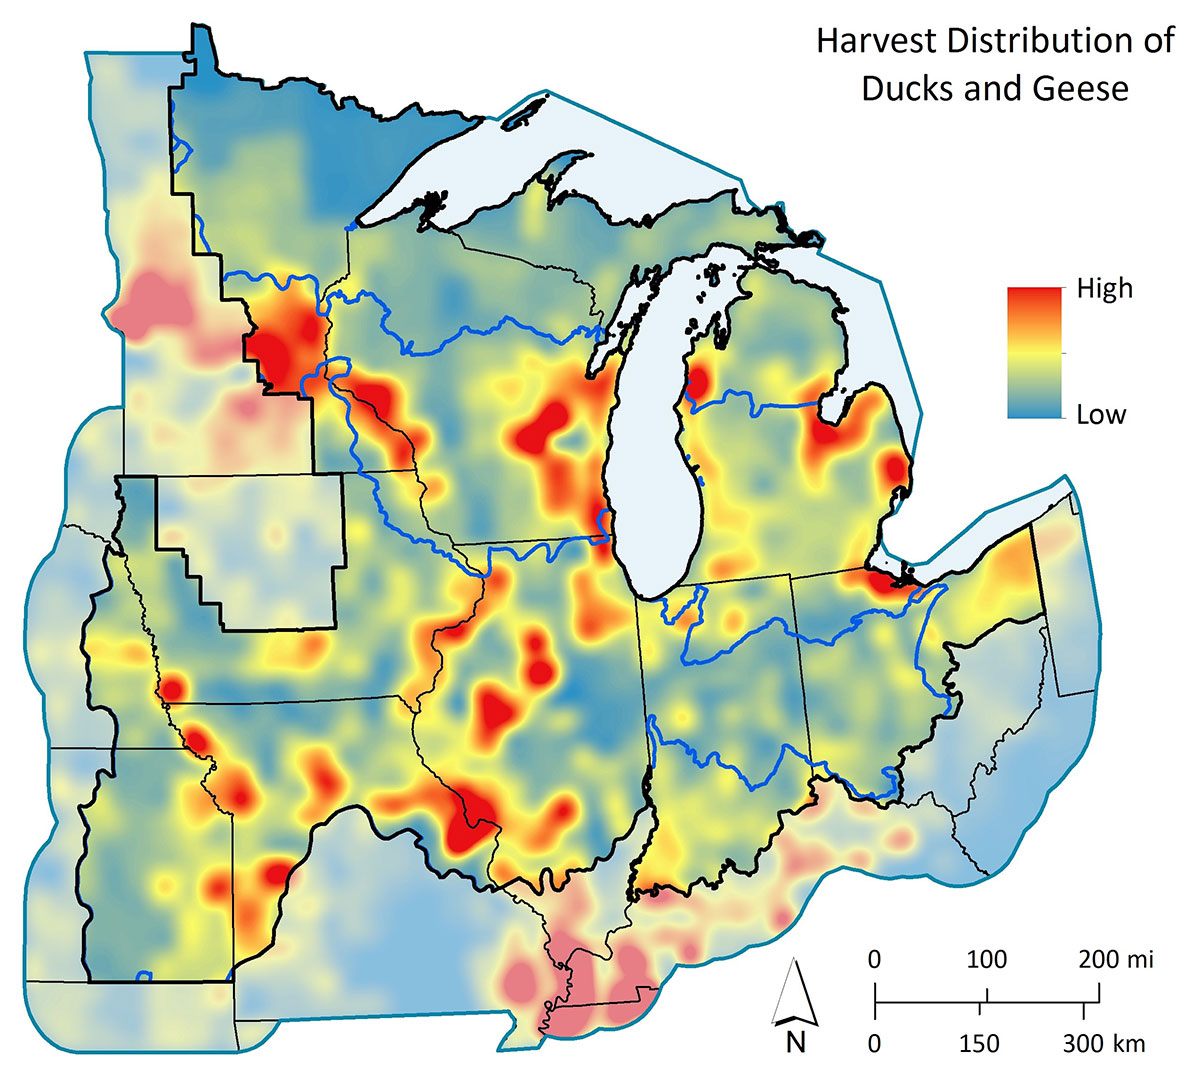
Harvest Distribution of Ducks and Geese
Distribution of important waterfowl hunting areas based on combined duck and goose county-level harvest (1995–2014) with data normalized by county size.
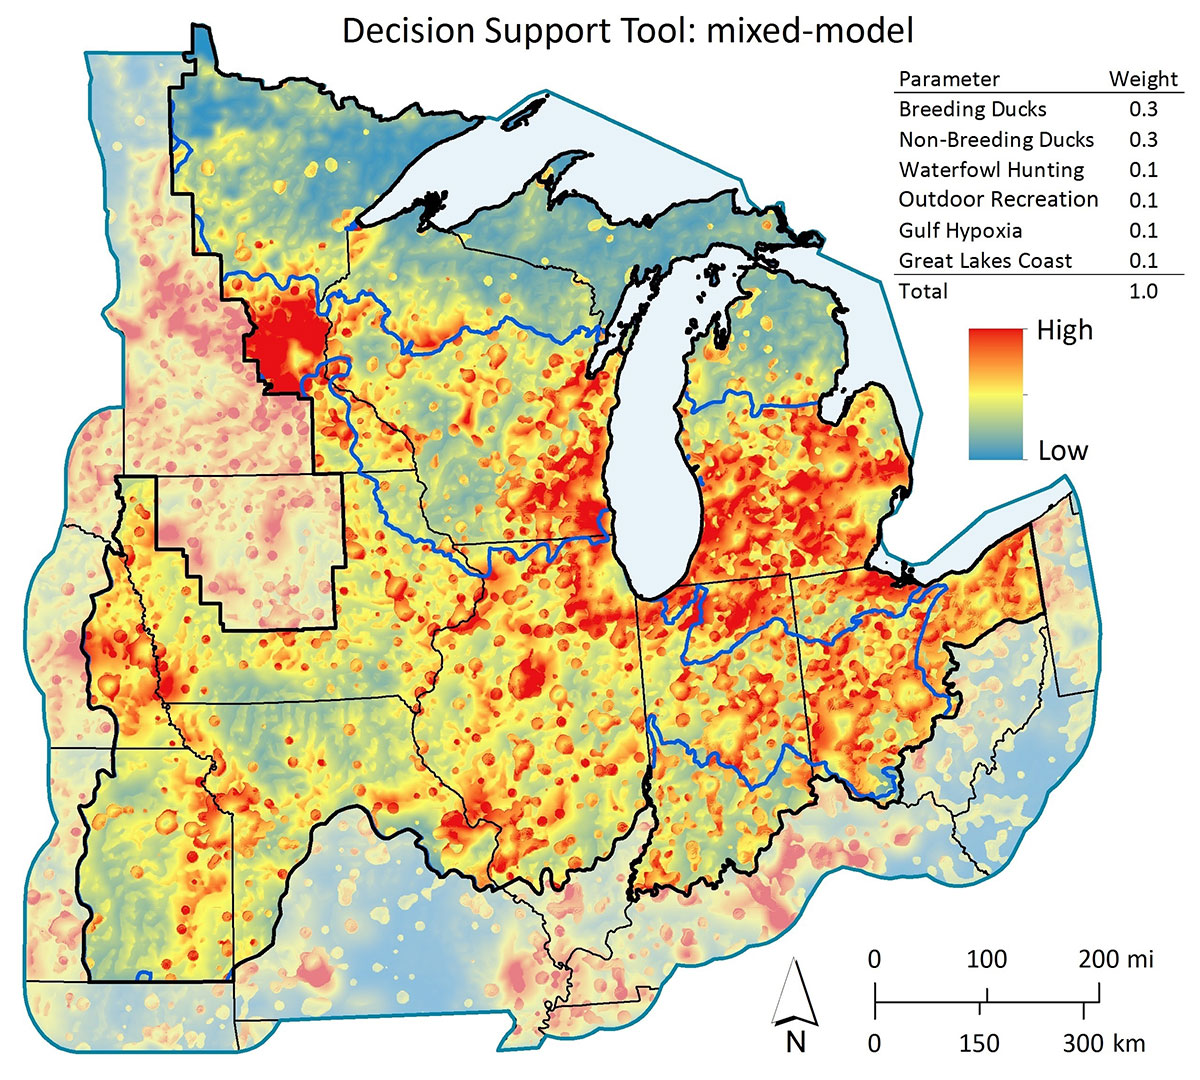
Decision Support Tool: mixed-model
Mixed-model of the Decision support tool (DST) to target waterfowl habitat conservation in the Upper Mississippi / Great Lakes Joint Venture (JV) region. The DST is a combination of six parameters, mixing biological (breeding and non-breeding waterfowl habitat) and social (waterfowl supporters and ecological goods and services) model-based maps weighted by regional waterfowl stakeholders. State and BCR boundaries (black and blue lines) designate the State x BCR polygons linked to JV waterfowl habitat retention and restoration objectives.
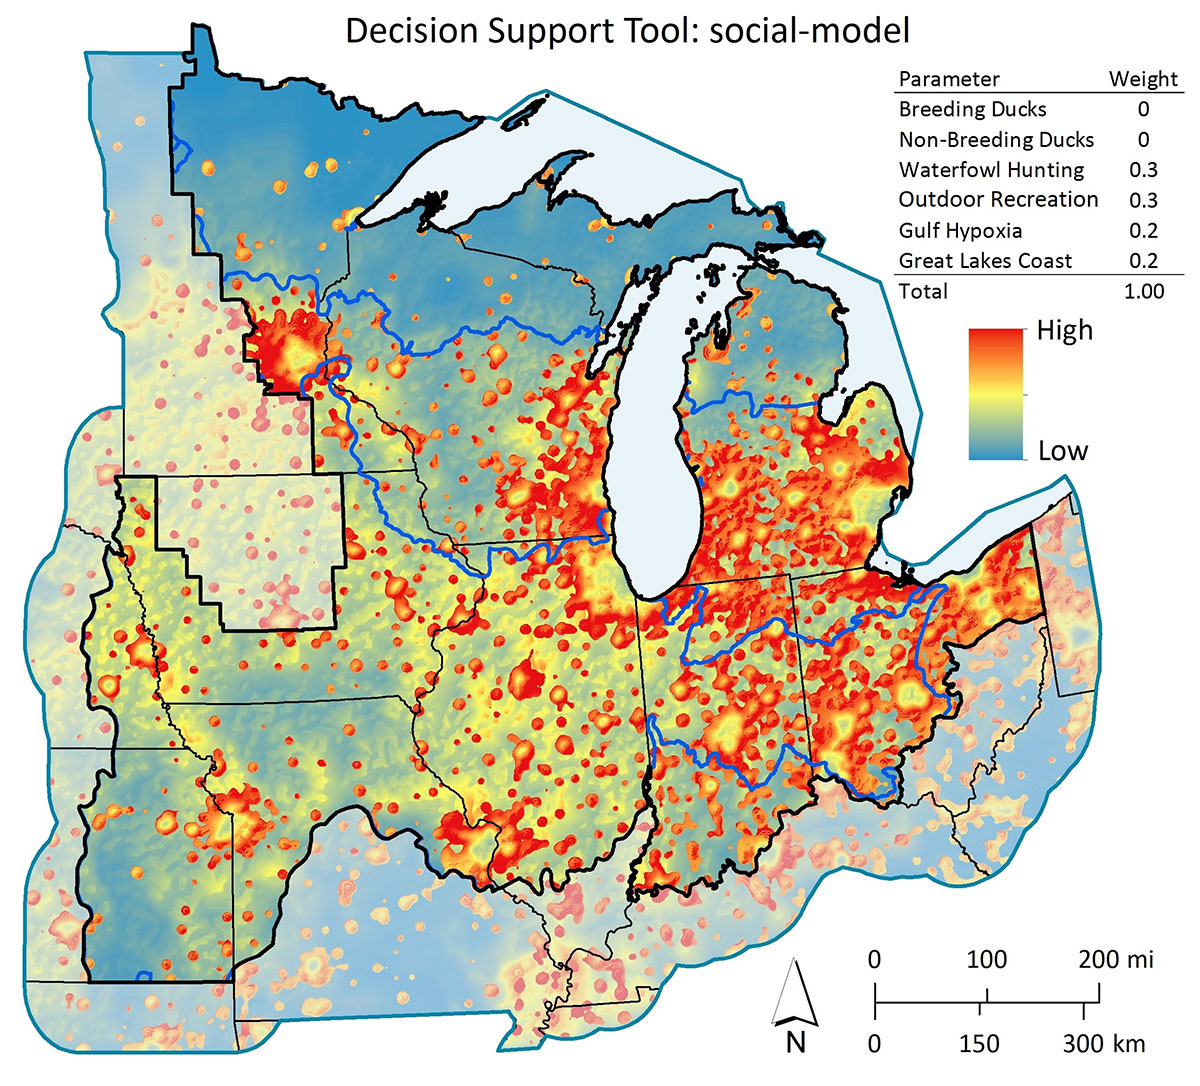
Decision Support Tool: social-model
Social-model of the Decision support tool (DST) to target waterfowl habitat conservation in the Upper Mississippi / Great Lakes Joint Venture (JV) region.
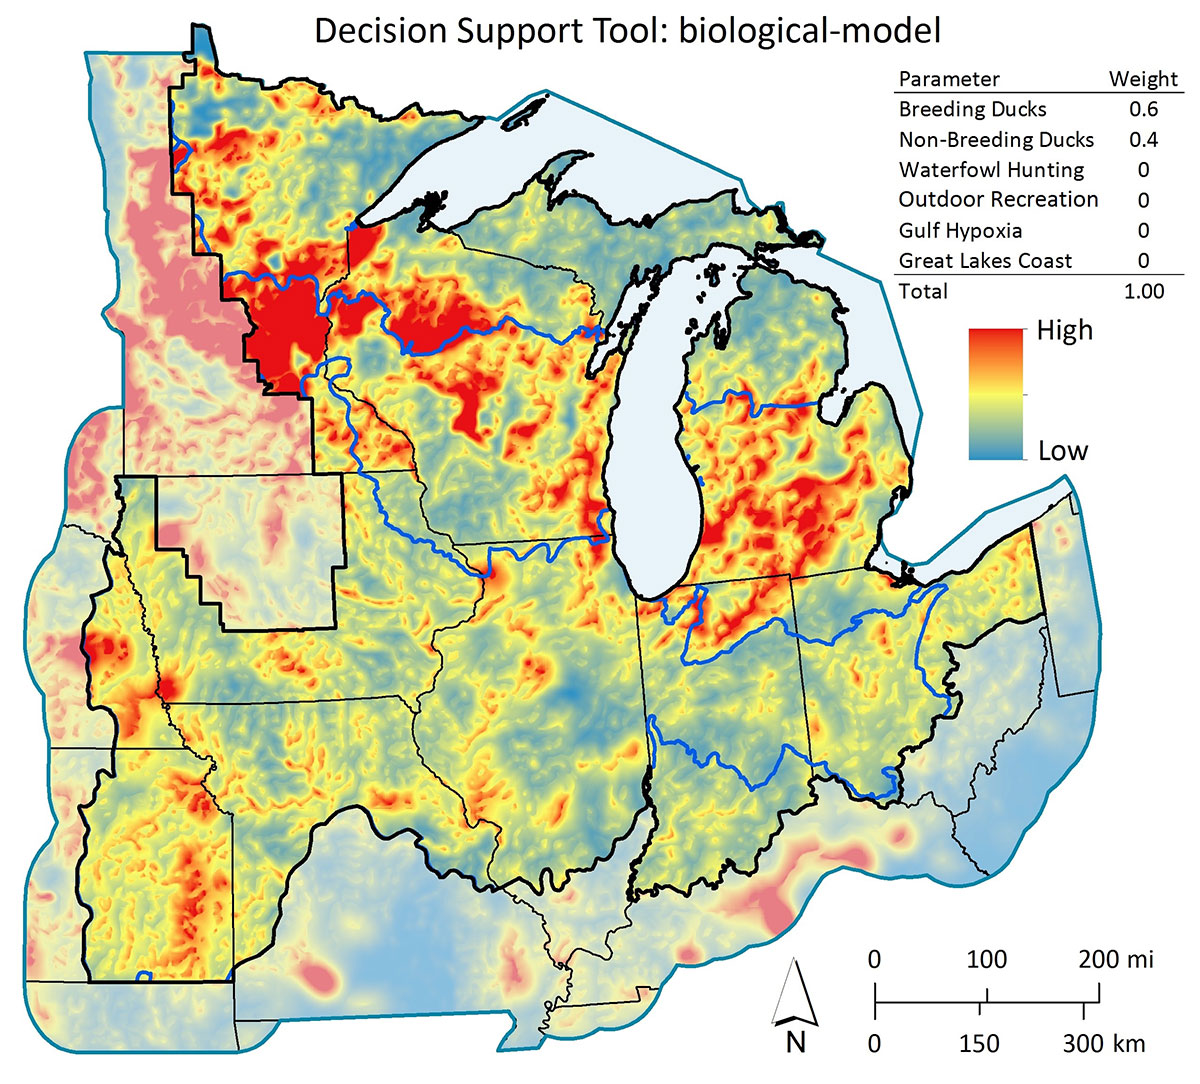
Decision Support Tool: biological-model
Biological-model of the Decision support tool (DST) to target waterfowl habitat conservation in the Upper Mississippi / Great Lakes Joint Venture (JV) region.
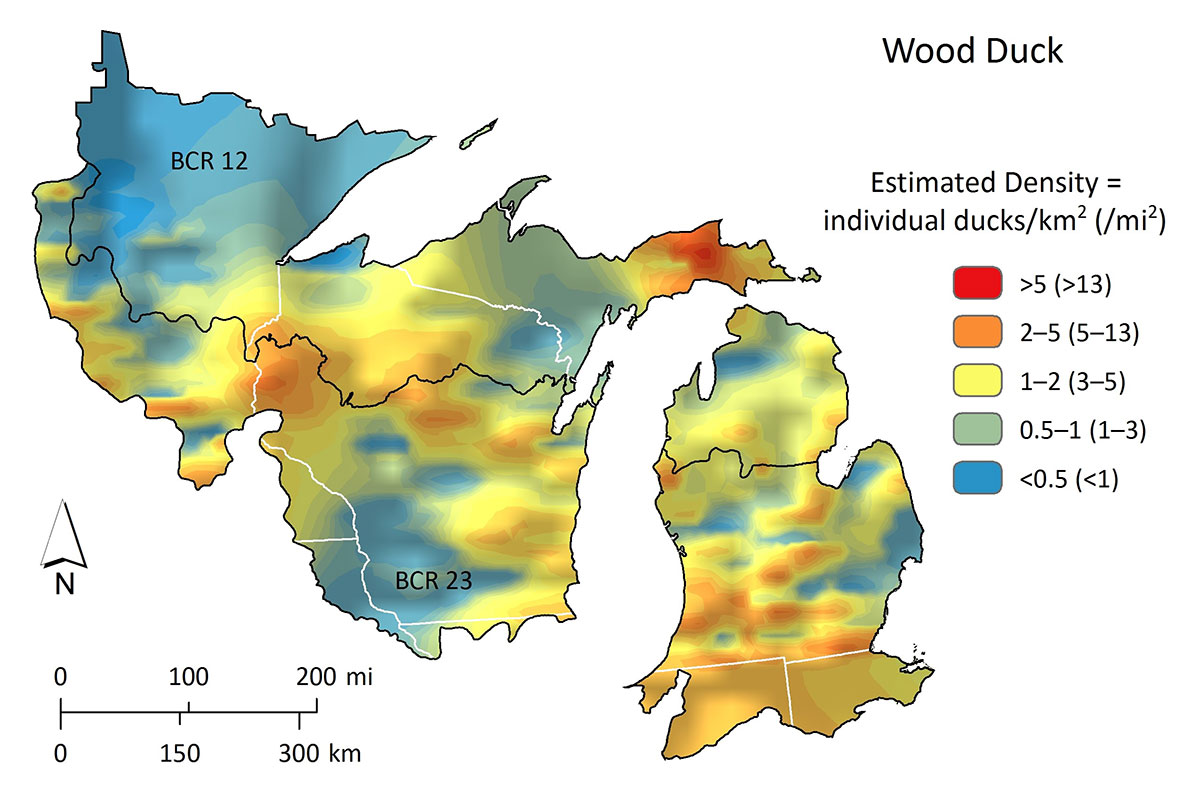
Population abundance and distribution of Wood Duck
Population abundance and distribution of Wood Duck. Data from the WBPHS (2005–2014) conducted in Michigan, Wisconsin, and Minnesota were used with kriging interpolation to depict primary breeding areas within BCRs 12 and 23.
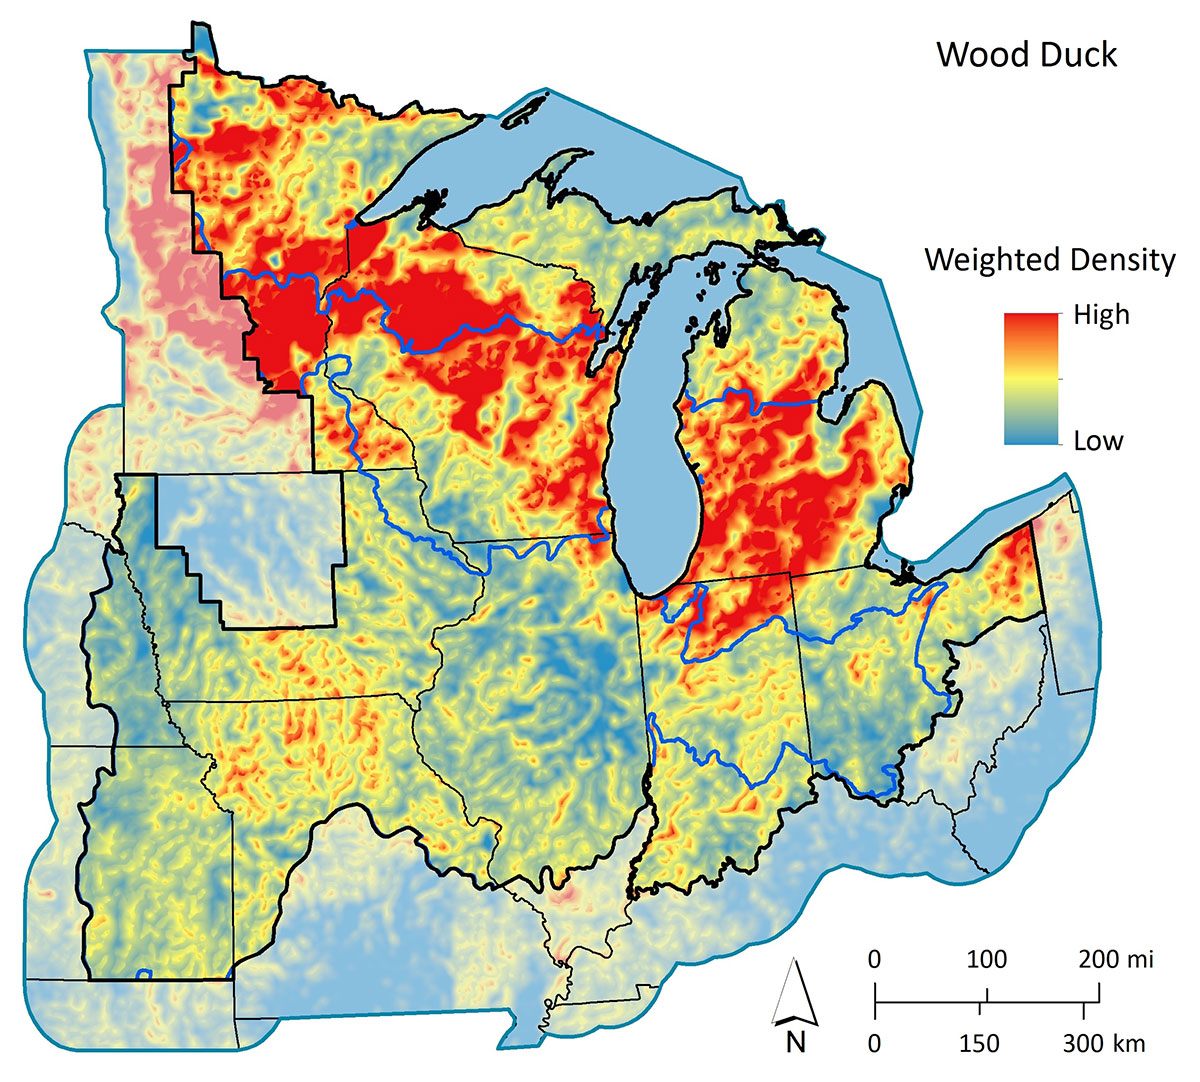
Density and distribution of breeding habitats for Wood Duck
Density and distribution of breeding habitats for Wood Duck. Wetlands and associated uplands with predicted highest suitability for breeding were extracted from latest NWI and NLCD 2011. Using kernel density analysis, distribution of the most suitable habitats for this species was depicted across the JV region and surrounding areas. Neighborhoods of relatively high number of suitable habitats and/or high Landscape Suitability Index (LSI) scores have higher predicted duck densities during the breeding period.
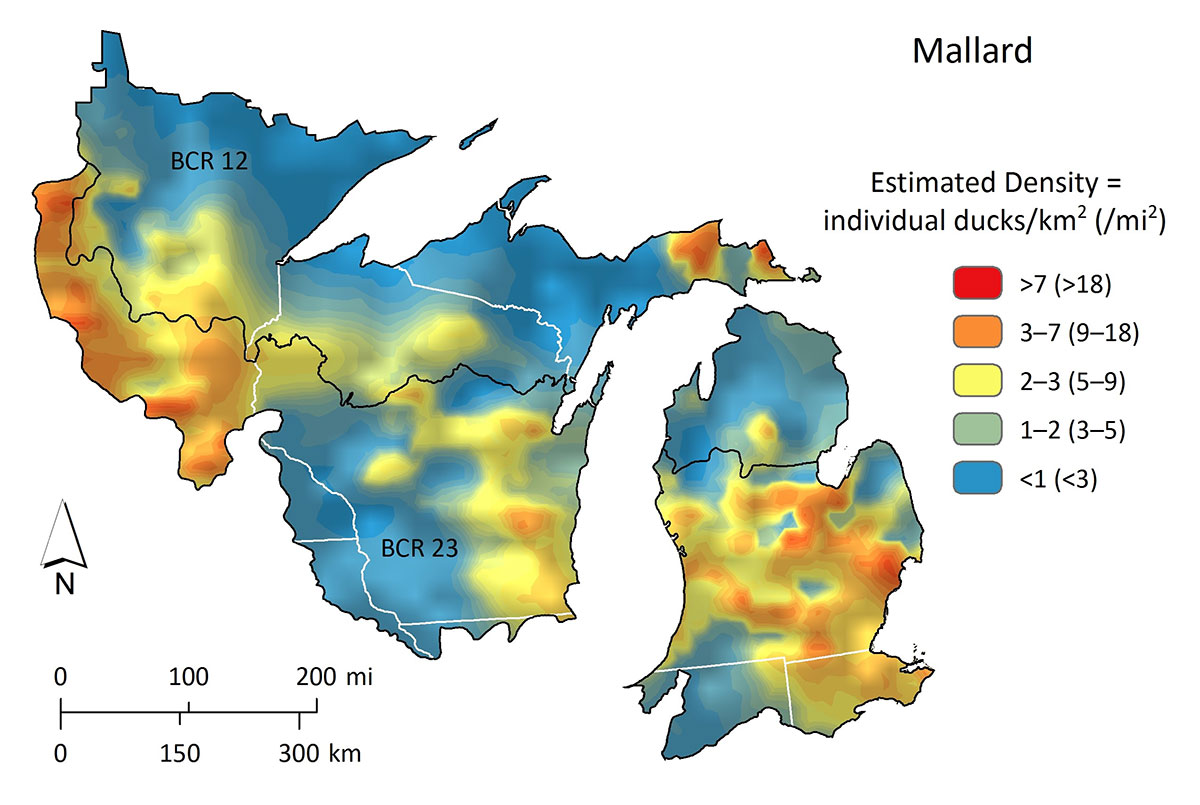
Population abundance and distribution of Mallard
Population abundance and distribution of Mallard. Data from the WBPHS (2005–2014) conducted in Michigan, Wisconsin, and Minnesota were used with kriging interpolation to depict primary breeding areas within BCRs 12 and 23.
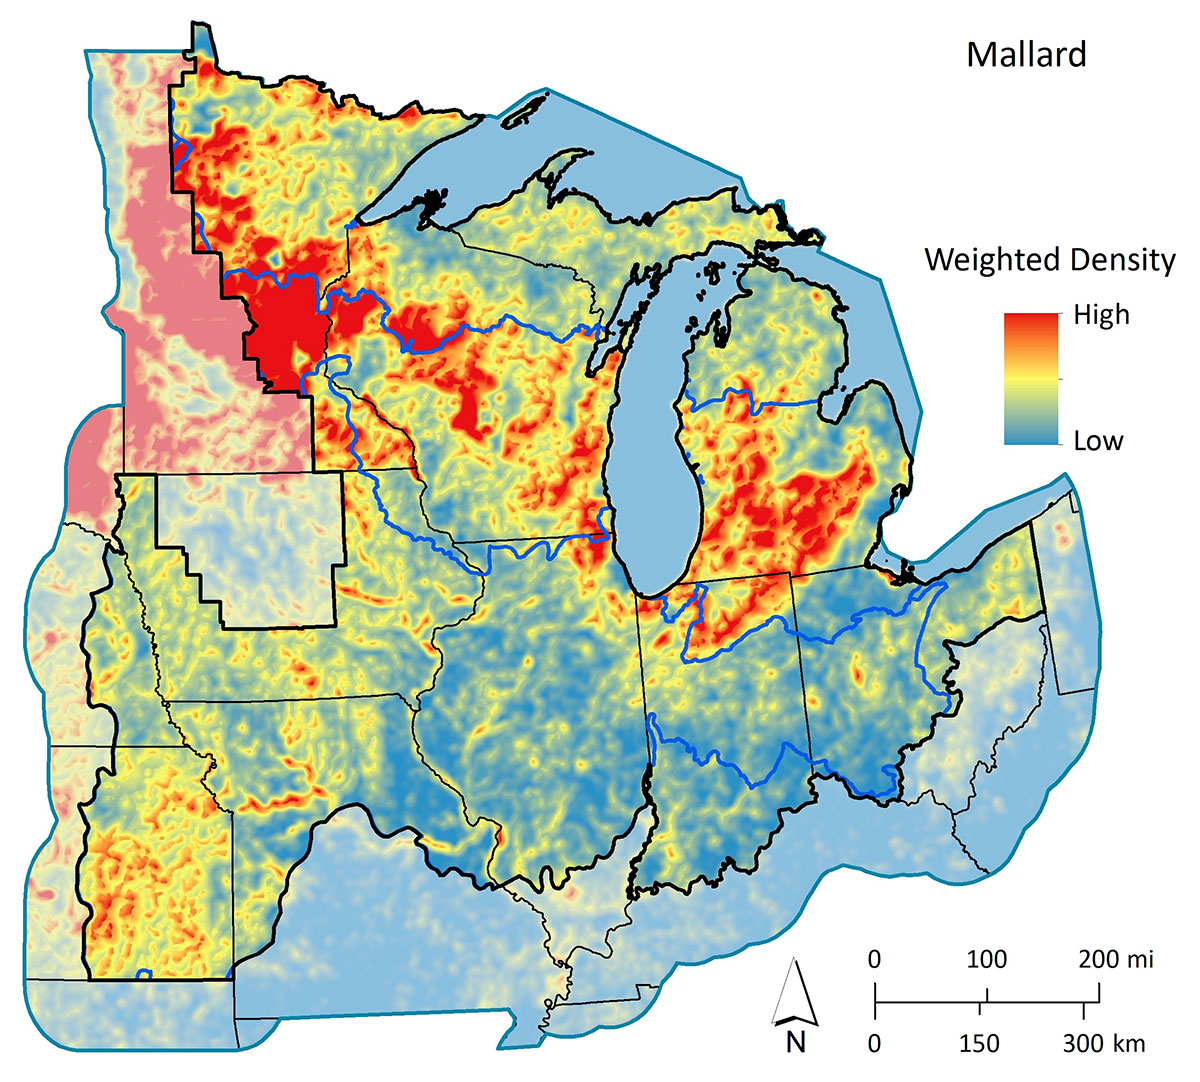
Density and distribution of breeding habitats for Mallard
Density and distribution of breeding habitats for Mallard. Wetlands and associated uplands with predicted highest suitability for breeding were extracted from latest NWI and NLCD 2011. Using kernel density analysis, distribution of the most suitable habitats for this species was depicted across the JV region and surrounding areas. Neighborhoods of relatively high number of suitable habitats and/or high Landscape Suitability Index (LSI) scores have higher predicted duck densities during the breeding period.
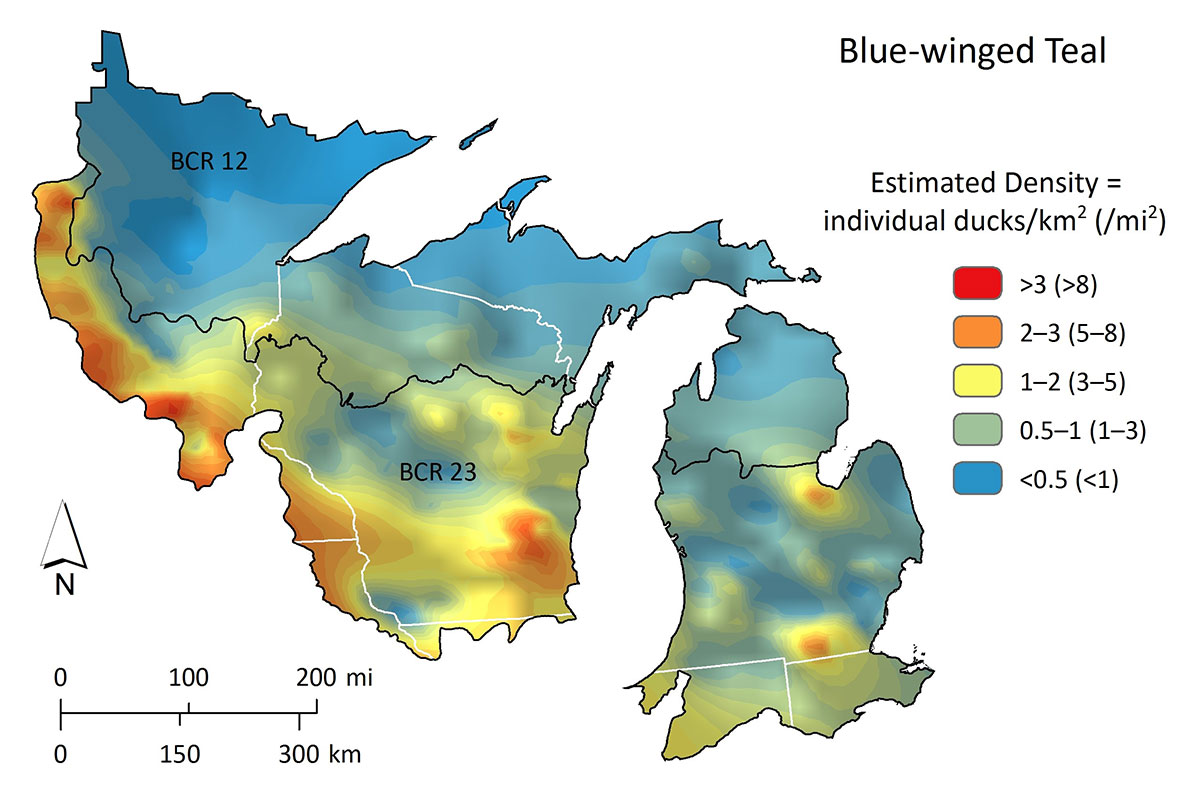
Population abundance and distribution of Blue-winged Teal
Population abundance and distribution of Blue-winged Teal. Data from the WBPHS (2005–2014) conducted in Michigan, Wisconsin, and Minnesota were used with kriging interpolation to depict primary breeding areas within BCRs 12 and 23.
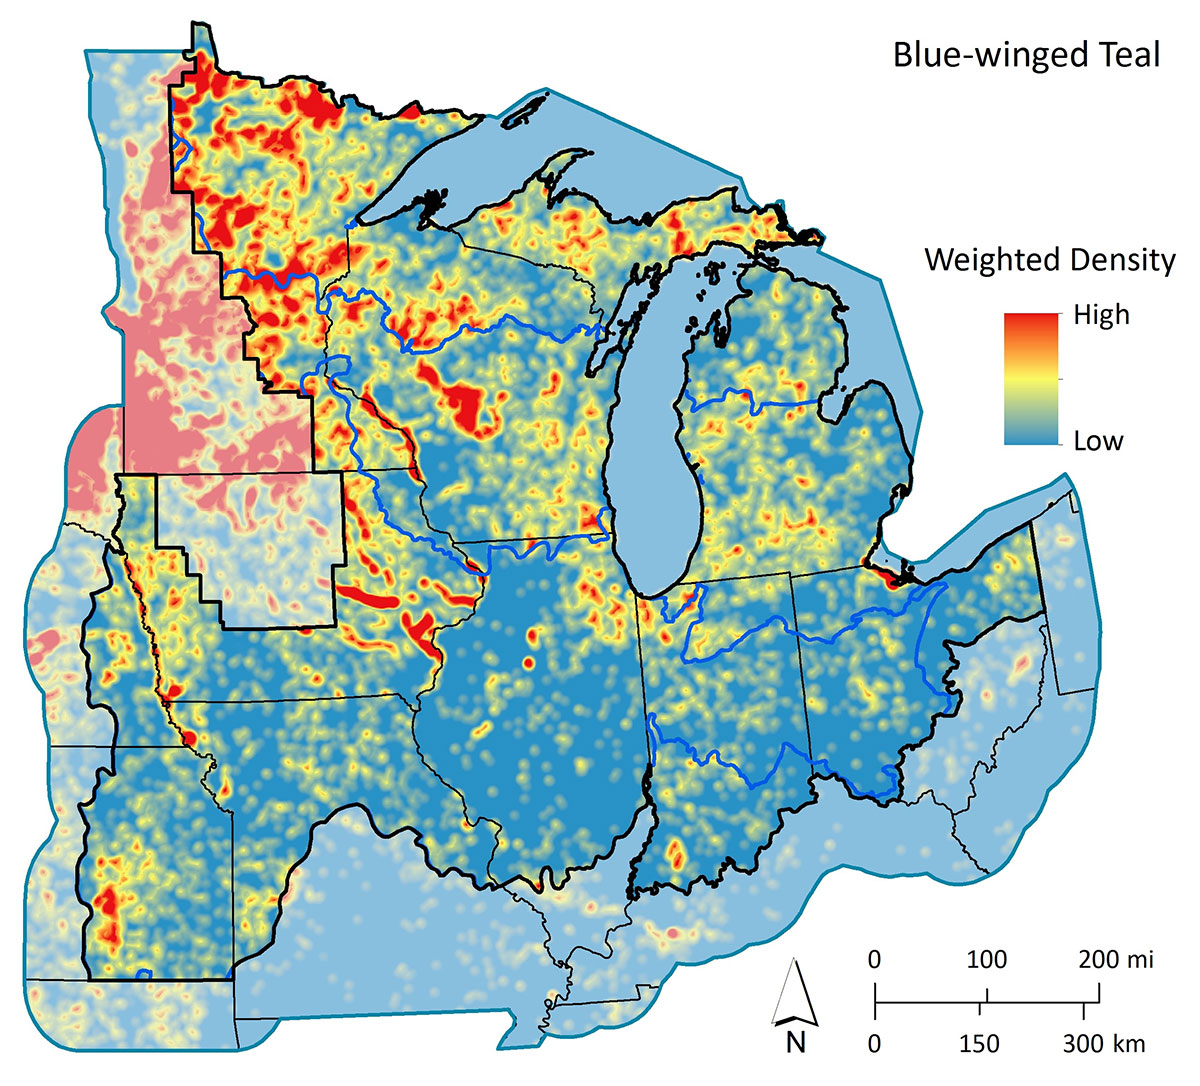
Density and distribution of breeding habitats for Blue-winged Teal
Density and distribution of breeding habitats for Blue-winged Teal. Wetlands and associated uplands with predicted highest suitability for breeding were extracted from latest NWI and NLCD 2011. Using kernel density analysis, distribution of the most suitable habitats for this species was depicted across the JV region and surrounding areas. Neighborhoods of relatively high number of suitable habitats and/or high Landscape Suitability Index (LSI) scores have higher predicted duck densities during the breeding period.
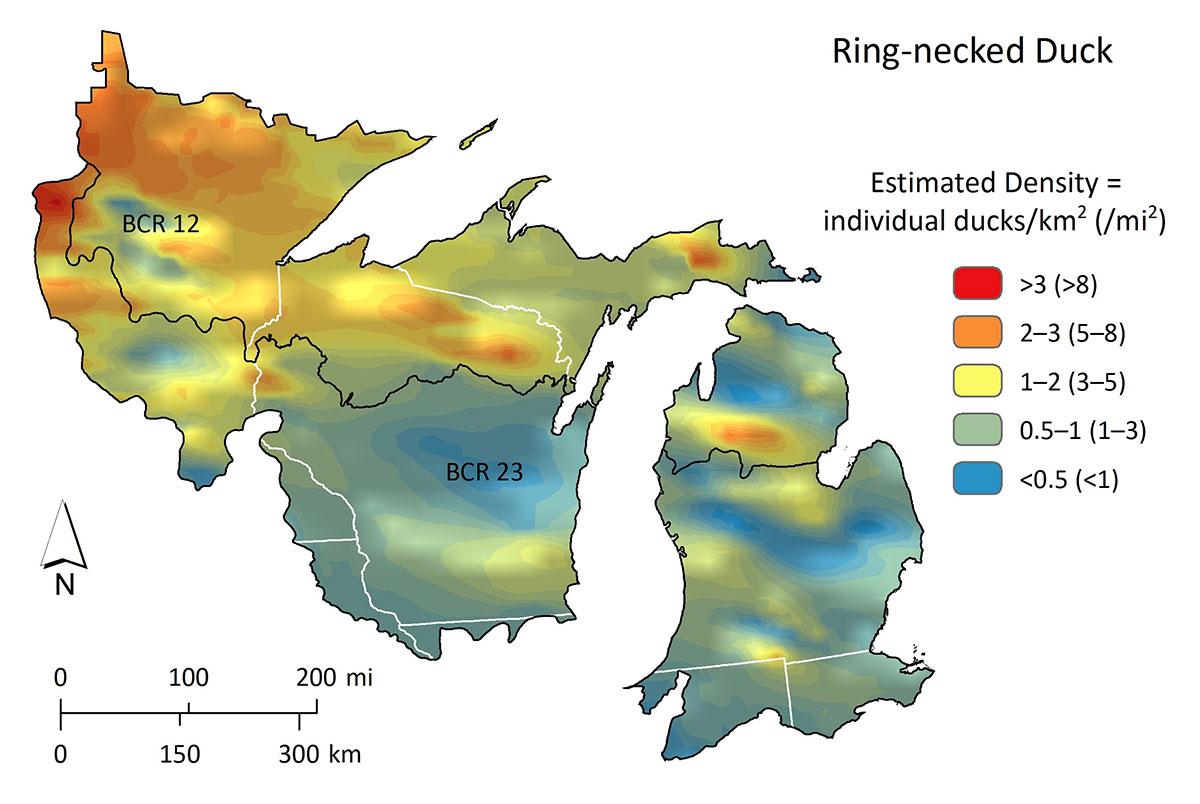
Population abundance and distribution of Ring-necked Duck
Population abundance and distribution of Ring-necked Duck. Data from the WBPHS (2005–2014) conducted in Michigan, Wisconsin, and Minnesota, plus special Ring-necked Duck surveys in Minnesota (2006–2013), were used with kriging interpolation to depict primary breeding areas.
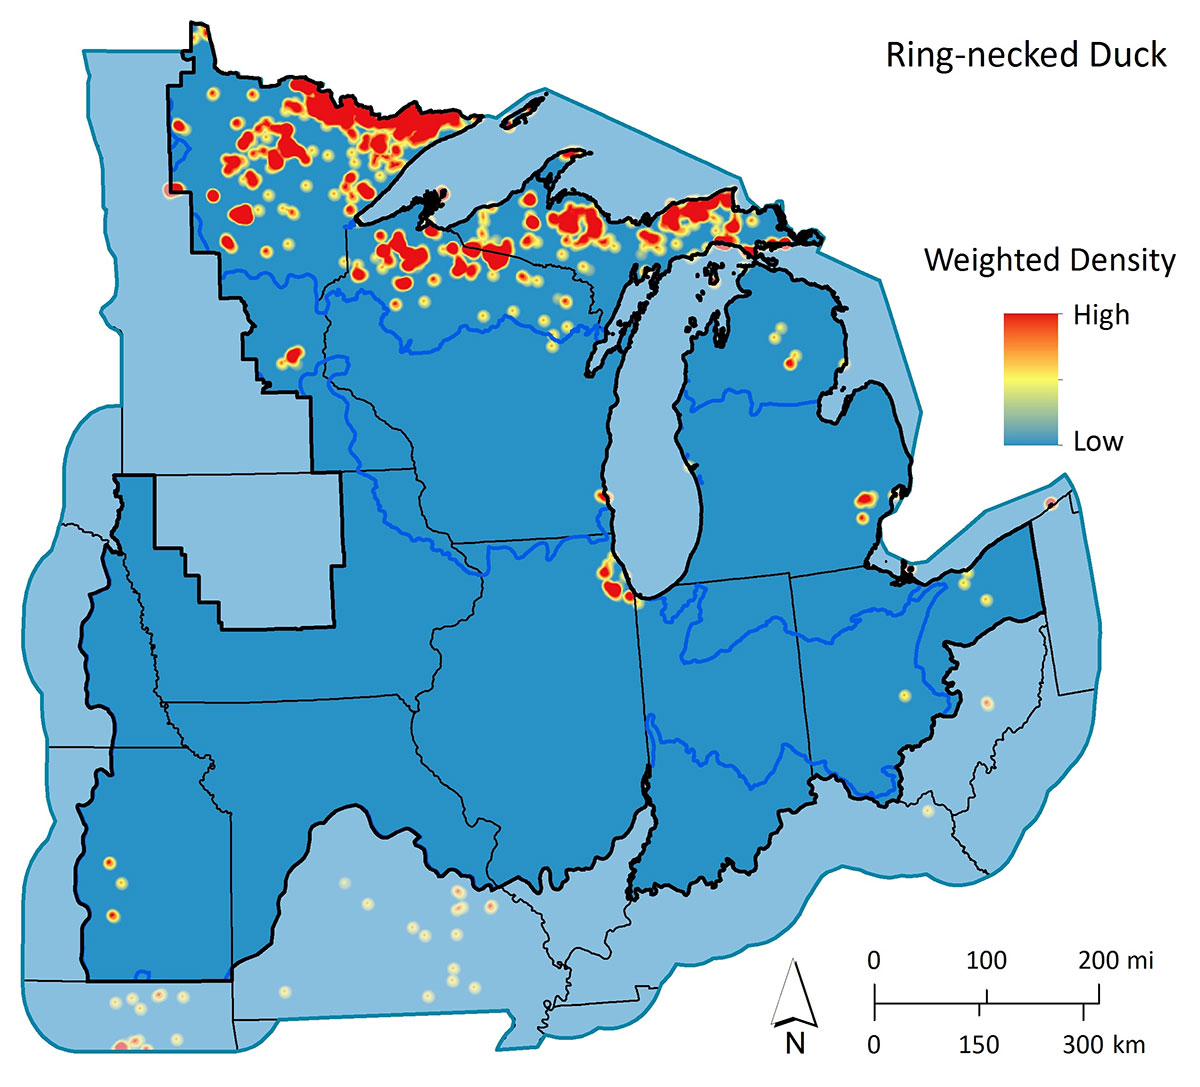
Density and distribution of breeding habitats for Ring-necked Duck
Density and distribution of breeding habitats for Ring-necked Duck. Wetlands and associated uplands with predicted highest suitability for breeding were extracted from latest NWI and NLCD 2011. Using kernel density analysis, distribution of the most suitable habitats for this species was depicted across the JV region and surrounding areas. Neighborhoods of relatively high number of suitable habitats and/or high Landscape Suitability Index (LSI) scores have higher predicted duck densities during the breeding period.
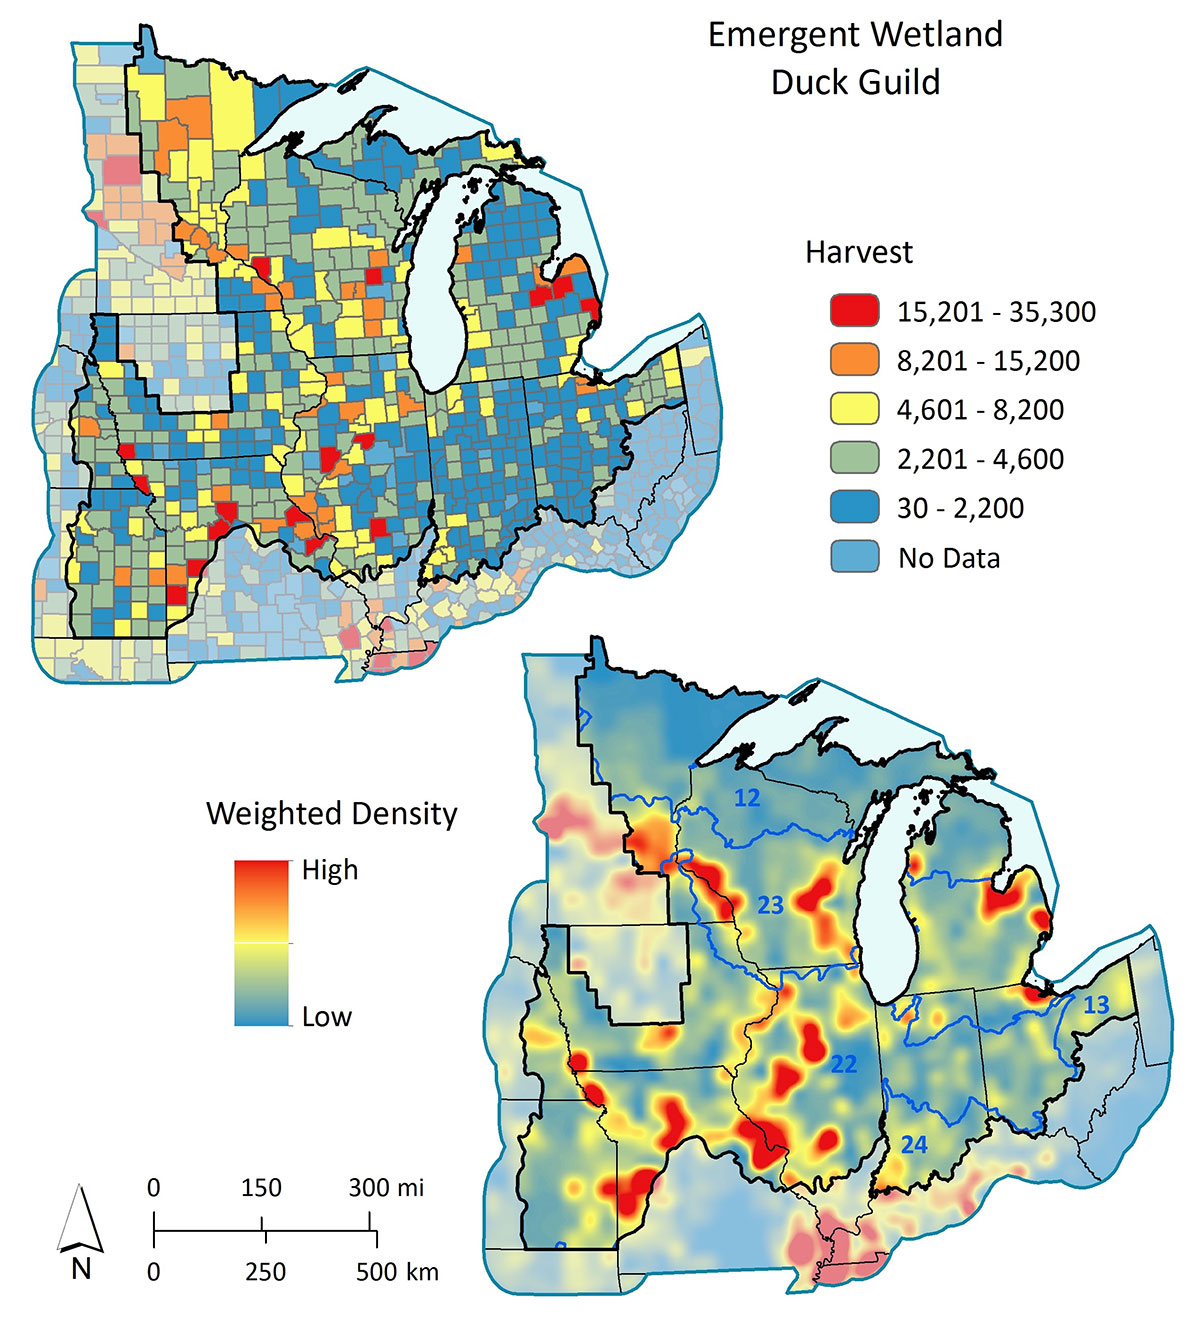
Harvest distribution of emergent wetland duck guild
Harvest distribution of emergent wetland duck guild. Harvest reflects the spatial distribution of birds, habitat, and hunters during fall and early winter.
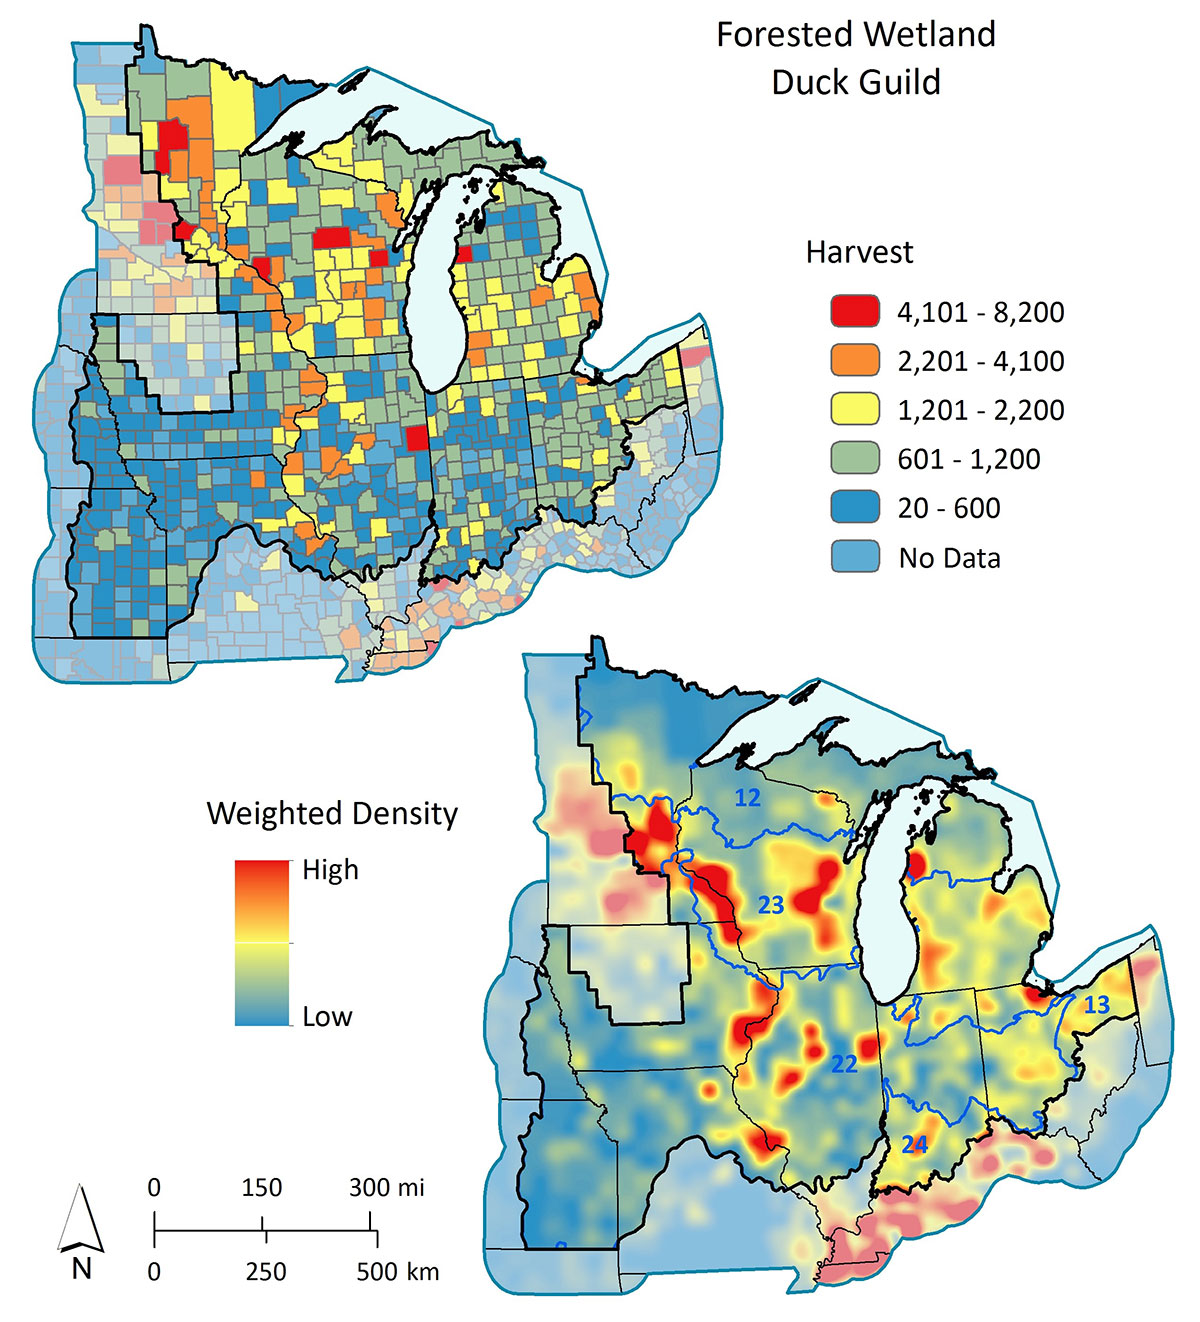
Harvest distribution of forested wetland duck guild
Harvest distribution of forested wetland duck guild. Harvest reflects the spatial distribution of birds, habitat, and hunters during fall and early winter.
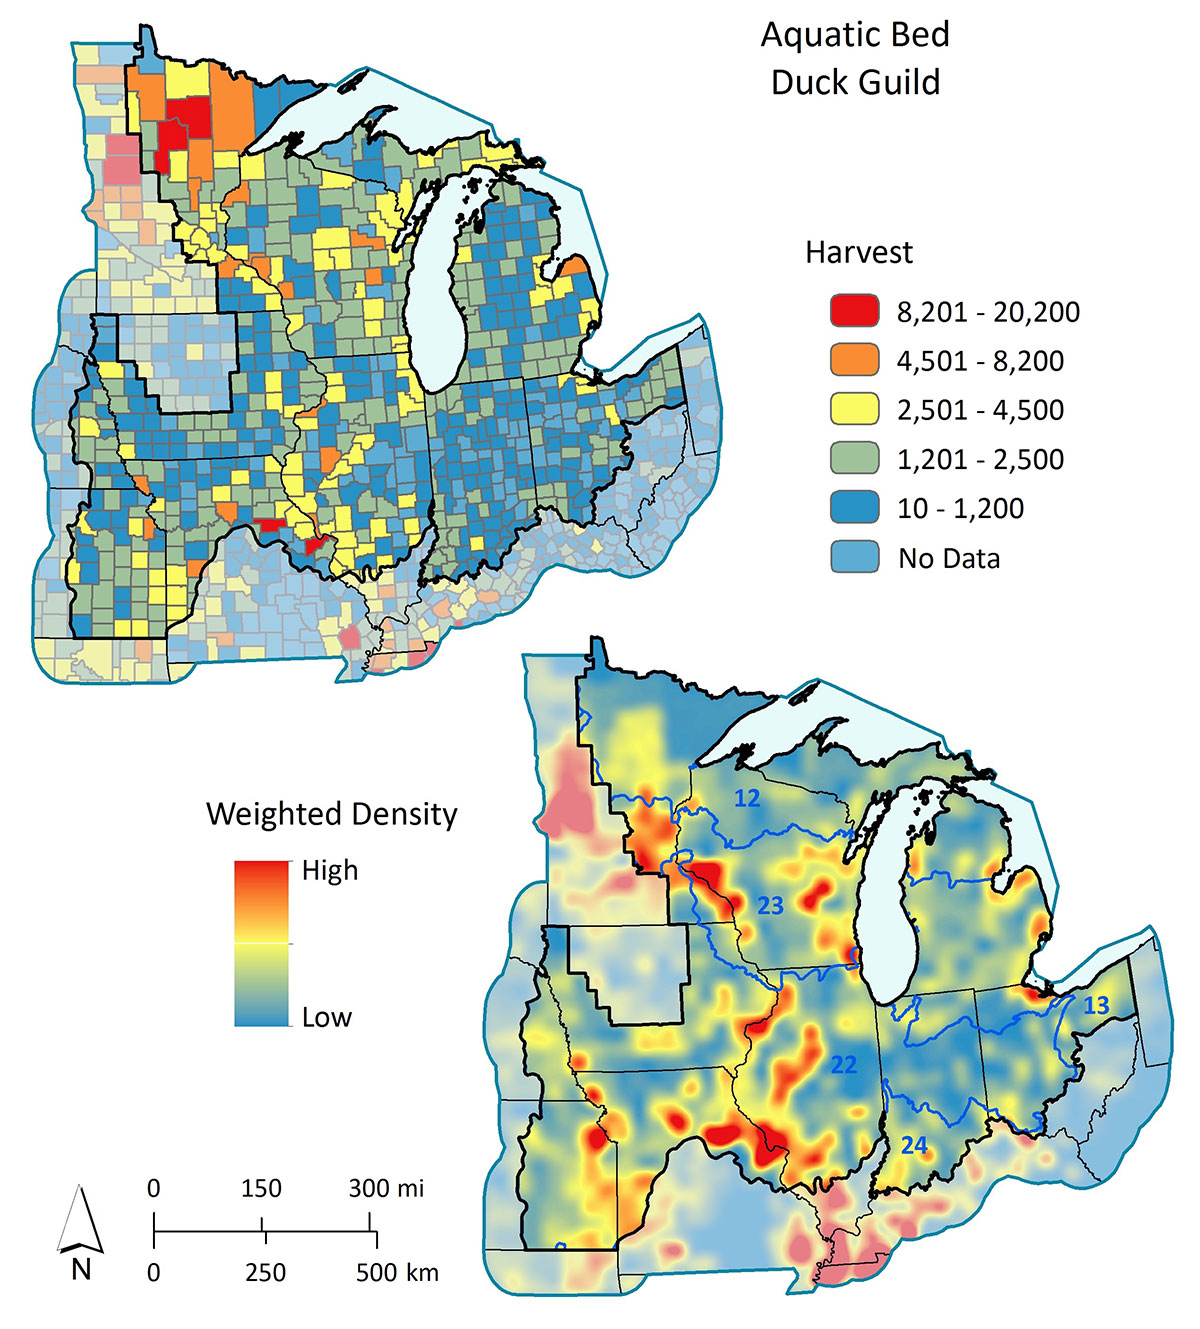
Harvest distribution of aquatic bed duck guild
Harvest distribution of aquatic bed duck guild. Harvest reflects the spatial distribution of birds, habitat, and hunters during fall and early winter.
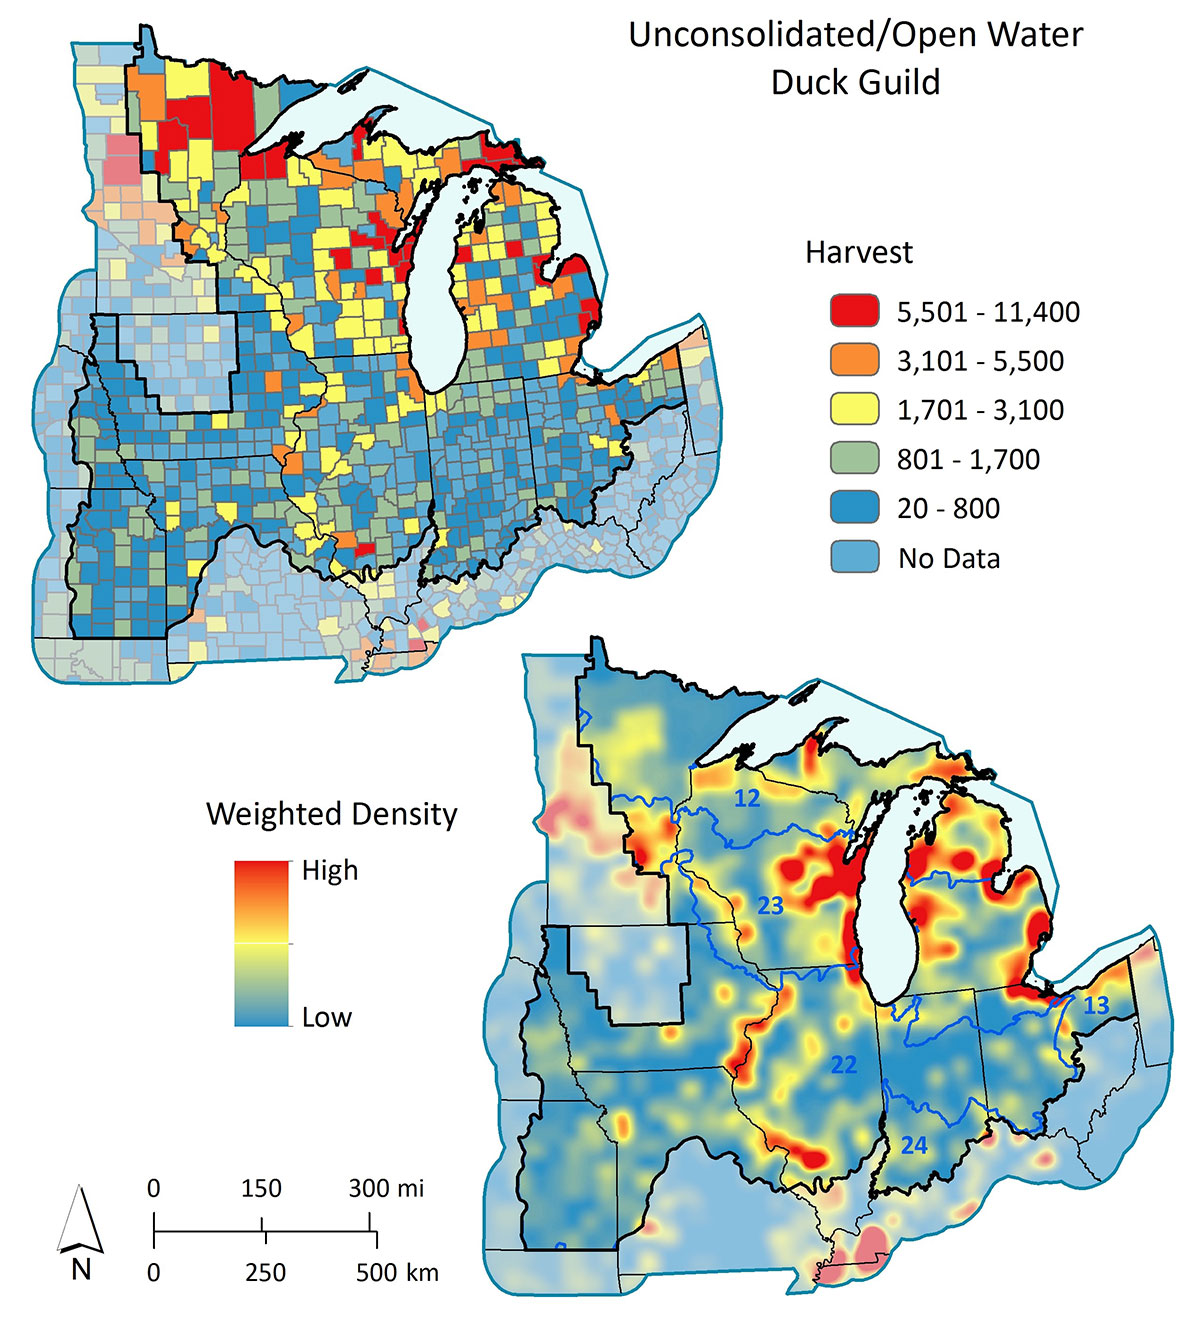
Harvest distribution of unconsolidated/open water duck guild
Harvest distribution of unconsolidated/open water duck guild. Harvest reflects the spatial distribution of birds, habitat, and hunters during fall and early winter.


